The way journalists report on the fiscal costs of spending programs is extremely unhelpful. The norm is to give some dollar amount projected over a decade. The problem with this norm is that a raw dollar figure does not tell the audience a whole lot. Is $100 million a lot? Is $100 billion a lot? Is $10 trillion a lot? Who knows?
One way to fix this problem is to divide the fiscal cost by the GDP. The US GDP is around $19 trillion right now. If you multiply that by 10 years, that gives you a GDP of $190 trillion (assuming no growth). This means that every $1.9 trillion in spending is only 1 percent of GDP. So, if a journalist reports the fiscal cost of a new program to be a whopping $2 trillion, you can just think to yourself “ah around 1 percent of GDP.”
The problem with the divide-by-GDP solution is that people also probably do not know how much GDP is a lot. Is 1 percent of GDP a lot? 5 percent? 10 percent? Once again, who knows?
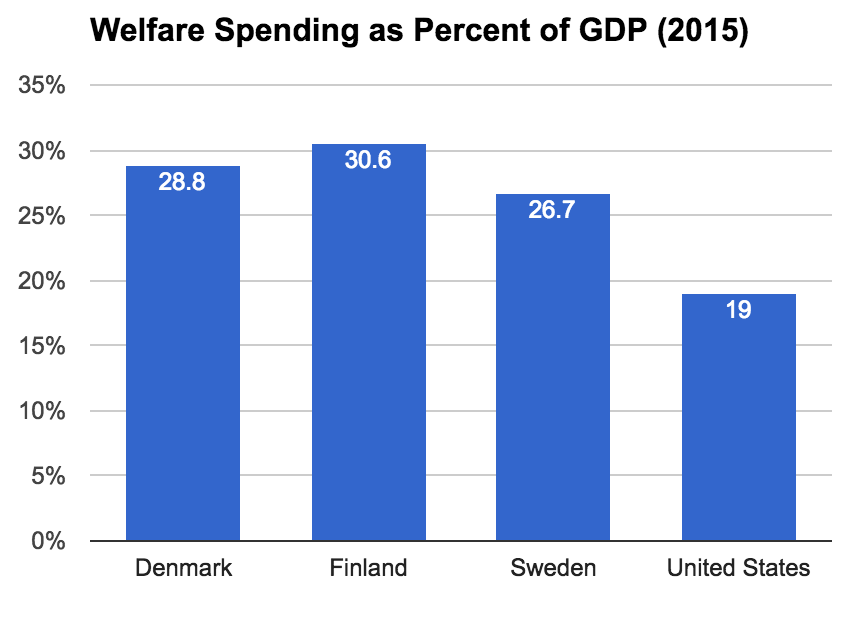
One way to answer this question is to compare our spending to other countries. Below is a graph of social expenditures (welfare spending) for the US, Finland, Sweden, and Denmark in 2015.
As you can see, the US trails by 7.7 to 11.6 percentage points. If we multiply the 7.7 percentage points by the $190 trillion GDP, that gives us a $14.6 trillion difference. Which is to say: if the US had Swedish levels of social spending, its 10-year social spending budget would be $14.6 trillion higher than it currently is. To get up to Finnish levels, it would be $22 trillion higher.
This means that if we want to get up to Nordic levels of public welfare expenditure (and we do), the US needs to increase social expenditure by at least $15 trillion. So the next time a journalist says some social program costs an unbelievable $1.5 trillion over 10 years, just think “ah one-tenth of the way there!”
