Steve Matthews has a piece in Bloomberg arguing that the underemployment rate among young college graduates remains elevated and that this is a sign that the labor market is unhealthy and that labor market slack still remains. I am sympathetic to the idea that the labor market remains unhealthy and that slack still remains, but this particular argument for that conclusion does not seem very compelling.
Here’s Matthews:
The relegation of college graduates to non-degree positions was once seen as a temporary blow for young people unlucky enough to graduate around the time of the deep 2007-2009 recession. Instead, millions of Americans like Reyer continue to face the same struggle.
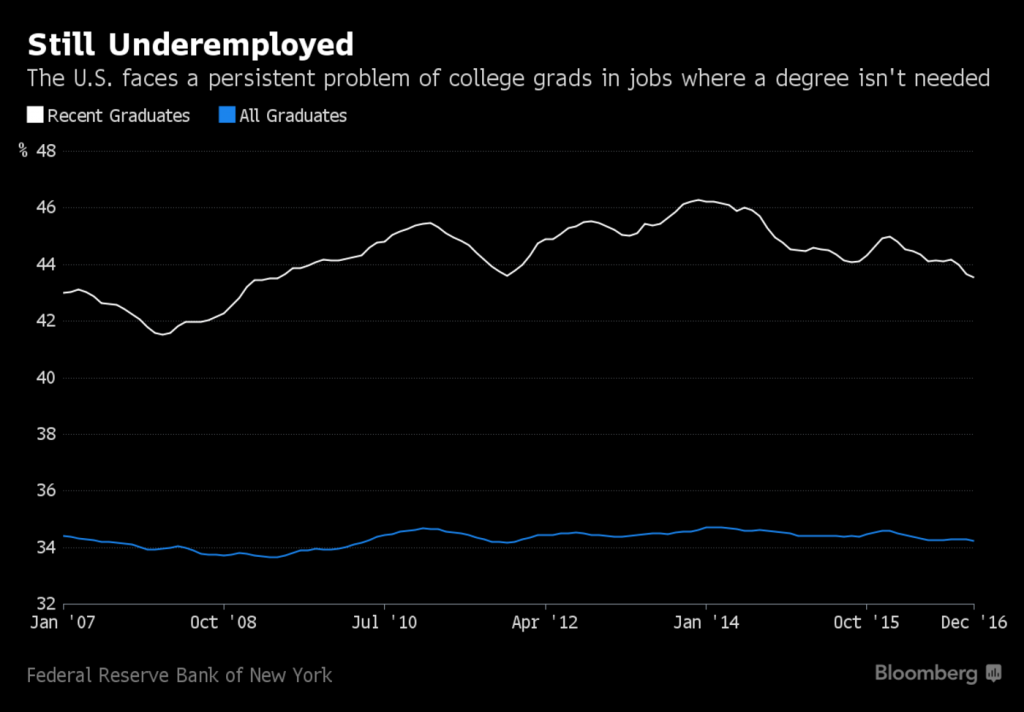
About 44 percent of recent college grads were employed in jobs not requiring degrees in the final quarter of 2016, not far from the 2013 peak of 46 percent, while the share of that group in low-wage positions has held steady, data from the Federal Reserve Bank of New York showed Wednesday.
That’s a sign that the nation’s labor market isn’t at full health, despite an unemployment rate forecast to remain at 4.7 percent in March, close to the lowest in almost a decade. In fact, the elevated level of college grads in non-college jobs could mean there’s still slack and that the Fed can go slow in raising interest rates, betting that more high-wage jobs will materialize. It could also mark a more permanent shift in employment that the Fed can’t fix and be a tough challenge for President Donald Trump and Congress.
Along with that text, Matthews shares this graph, showing the percent of recent graduates and college graduates overall who are in jobs that do not require a college degree.
Whenever someone is making an argument about the effect of the Great Recession, I am always curious to see what the data looks like prior to the Great Recession. Starting the trend line in 2007 does not give us a good indication of what normal actually looks like.
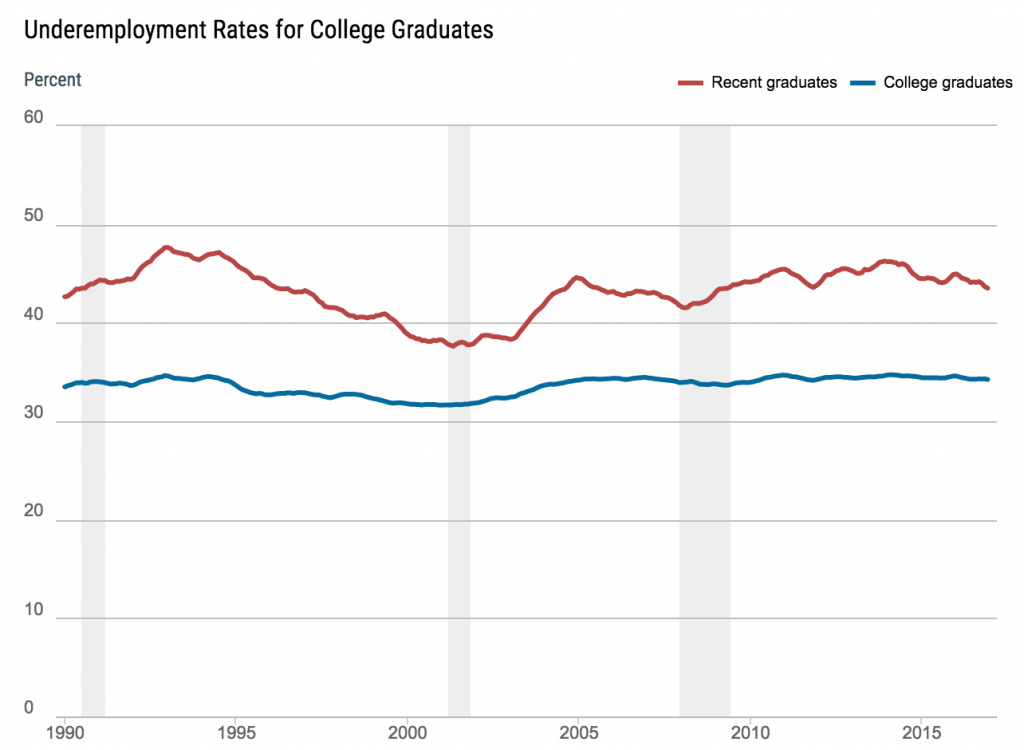
Luckily the New York Fed runs this data series back to January 1990 on its website. The graph looks like this:
The current figure (43.5% in December 2016) is higher than the series low point (37.6% in May 2001), but it is lower than the series high point (47.7% in December 1992). More generally, it seems as if the current figure is within the normal range.
On its face, it is kind of surprising that the figure has not budged much over the last few decades. College attainment has increased significantly over this period and so you might expect that the percentage of graduates who are underemployed would go up.
One reason why this may not have happened in this data series is the way they define what jobs require a college degree and what jobs do not.
The underemployment rate is defined as the share of graduates working in jobs that typically do not require a college degree. A job is classified as a college job if 50 percent or more of the people working in that job indicate that at least a bachelor’s degree is necessary; otherwise, the job is classified as a non-college job.
Because they define a job as requiring a college degree if the majority of people in the job say it does (i.e. it is not based on an objective assessment of the skills required), this means that jobs that used to require a high school degree but now require a college degree are scored as college-degree jobs. Put another way, this particular measure is not able to disentangle the effects of credential inflation. When the credentials for the same job go up, this measure transforms it into a job requiring a college degree and therefore a job that no longer counts as underemployment for a college graduate that fills it.

