I wrote a post yesterday pointing out that the real story of Doug Jones’s upset in Alabama was the inordinate amount of white support for the Democratic candidate. In support of this position, I used the 2008 and 2012 exit polls to show that black turnout was no different in 2017 than those years, and yet those years saw the Democrat lose by over 20 points while this election saw the Democrat win by 1.5 points. Some basic math and reasoning tells us that the difference between losing by over 20 points and winning by 1.5 points was not high black turnout but rather white voters supporting the Democrat by much higher margins than they typically do.
The post did not really have a point beyond that. There is no clear reason why this helps any of my political preferences. I just thought it would be worthwhile to tell the truth about the Alabama outcome in the face of nearly unanimous misreporting about what happened.
Because people who are real into politics often follow it in the same way normal people follow TV shows (i.e. with huge emotional investment in the drama, characters, and plot development), this post attracted a lot of weird ire. Most of the weird ire was just that: strange outbursts with not even an attempt at making a substantive point. But there was one argument that some brought up that is worth addressing here.
The argument goes like this: It is not right to compare the 2017 election to the 2008 and 2012 elections because the latter two were presidential elections. If you want to really figure out whether black turnout or different white voting behavior was the primary cause of Jones’s victory, you should use midterms or other special elections as comparisons.
This argument poses some practical difficulties because no such data exists for comparison. But you can fiddle with the exit poll data to simulate what a normal low-black-turnout midterm election would look like and see that, relative to such an election, it is still the case that the change in white voting behavior was by far the largest factor in Jones’s victory.
To do that, I created the following baseline scenario. For this scenario, I took the 2017 exit polling data and I subtracted 5 points from the black share of the electorate and added 5 points to the white share of the electorate. This simulates what would have happened if black turnout had been massively lower. For this scenario, I also place white Democratic support at 15% (this was what percent voted for Obama in 2012) and I place black Democratic support at 96% (this was what percent voted for Jones in 2017).
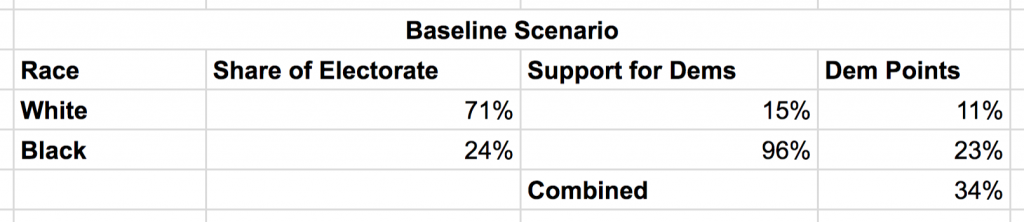
As you can see, in the baseline scenario, Doug Jones only gets 34 points from black and white voters combined.
From this baseline scenario, we can simulate what would happen if black turnout increases to the level we saw in the Jones election. Holding all else equal, increasing the black share of the vote from 24% to 29% and decreasing the white share of the vote from 71% to 66% gives us this outcome.
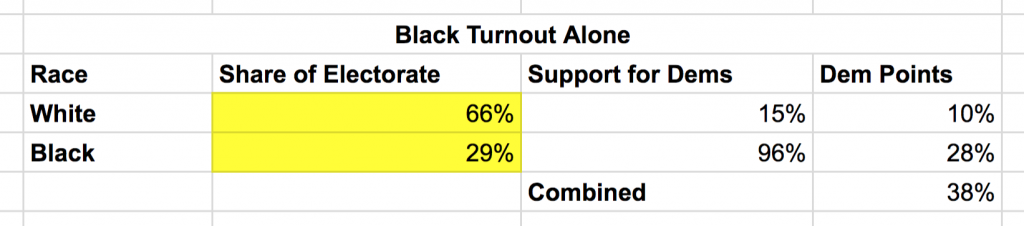
Jones’s point total rises 4 points from 34 points to 38 points.
From the baseline scenario, we can also simulate what would have happened if white voters had swung towards Jones in the magnitude they did, but black turnout had remained unchanged. We do this by increasing the percent of whites voting for Democrats from 15% to 30% (Jones got 30% of the white vote), holding all else equal.
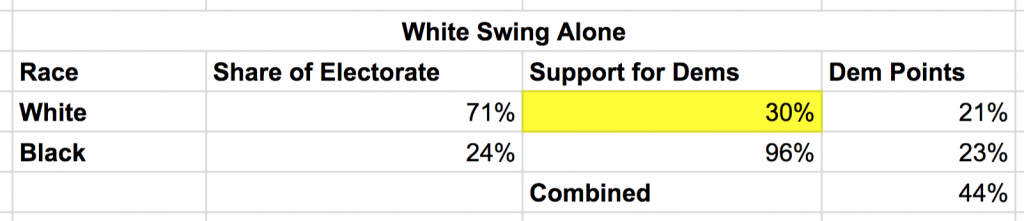
Jones’s point total rises 10 points from 34 points to 44 points.
Finally, we can bring in the actual 2017 data, which both combined high black turnout and the white swing together.
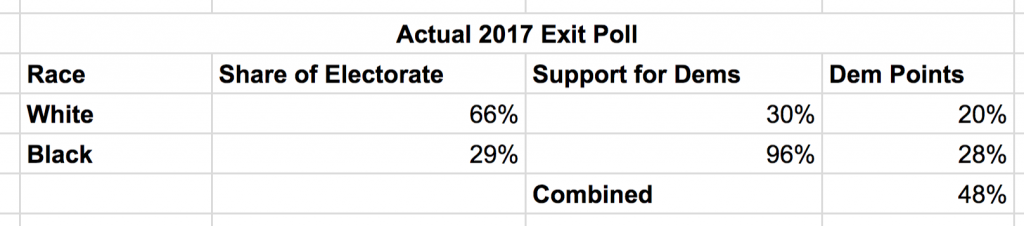
As you’d expect, Doug Jones gets 48 points under this scenario, which is 14 points higher than under the baseline scenario.
So the total difference from the baseline scenario is 14 points. The change in the white vote is responsible for 10 of those points and the change in black turnout is responsible for 4. This means the change in white vote was 2.5 times as important as the high black turnout.
Of course, all I have done here is simulate a low-black-turnout, normal-white-GOP-support election by fiddling with the numbers in a spreadsheet. You could pick different values if you want and get somewhat different magnitudes. But there is no plausible baseline in which changes in black turnout contributed more to the Jones victory than changes in the white vote.